
Short Of Time? Watch this short video instead!
In the extraordinary times we’ve seen this year, it likely would have been easy to expect that the housing market would be one of the ones hit hardest by the pandemic. However, in residential property prices as of October 2020, there have been many new records set and demand has been high. Today we’re going to share some of the most exciting developments that the property market has seen over the last few months.
Key Considerations for Investors:
- The effect of working remotely, a move to the suburbs?
- Stamp Duty Holiday, does this effect your market?
- Savings and stimulus of Lockdowns, more money in people’s pockets today
- Are Sales STC being transacted upon?
Summary:
- Records have been set, demand is high
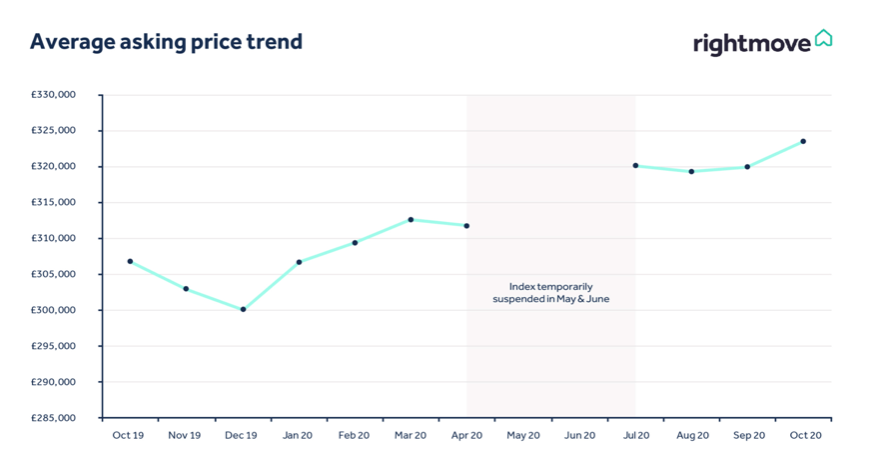
- Highest growth in average asking for 4 years
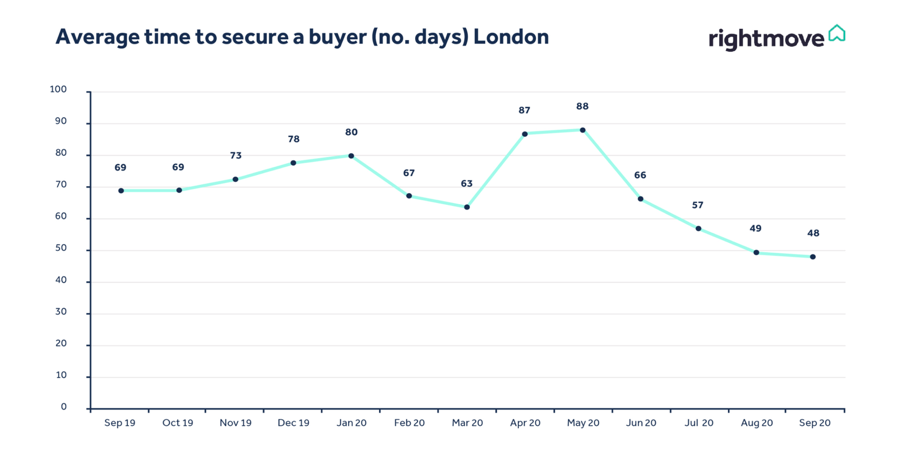
- Speed of securing a buyer is increasing
One of the most impressive growth rates we’ve seen this year has been the average price of a property coming to market. From September going into October, we saw a 1.1% increase in the average property price and 5.5% increase from last year. This has meant the average asking price has shifted from £319,996 to £323,530, a national record and the highest annual growth we’ve seen for over four years. We can expect that some of this momentum is going to be as a result of delayed house moves as well as new demand. While many expected the demand for residential property moves to drop this year, this prediction has not materialised. Buyers are perhaps going to have altered needs going into 2021, so it’s likely that these increases will continue through to the end of this year. If we look at how the pandemic has affected the average asking prices this year, the 1.1% increase in October 2020 has showed tremendous progress since the 0.2% increase as of last month in September and a 0.2% decrease the month before, matching the last figures we have of April 2020 and the close of the market while lockdown ensued. With that in mind, demand is still out weighing the supply of houses, in particular for middle-range properties for both first-time buyers and investors.
How Quickly You Can Find A Buyer
Over the last few months, the average time needed to find a buyer has decreased month-on-month since the height of the pandemic in April and May. While it may have taken 80+ days to find a buyer nationally, these numbers have gradually fallen to 50 as of September 2020. This number is 12 days quicker than the same period last year, and the fastest we’ve ever seen before, and has markedly left many agents with more properties listed as sold than are for sale for the first time in history. In fact, the number of properties sold by agents during the month of September has been 70% higher than the same period last year. The effective close of the market for 2-3 months this year would have caused a boost in the numbers seen around now, but there have been 2% more sales so far this year compared with the last. This means that while these sales may be coming in thick and fast now, there is also new demand for housing. As far as this month is concerned, the growth continues with a 58% higher reported number of sales from the same period last year. When this happens, prospective buyers can look at the market and see how fast properties are selling, they may even see it happening around their own local neighbourhood through the amount of For Sale and Sold signs popping up.
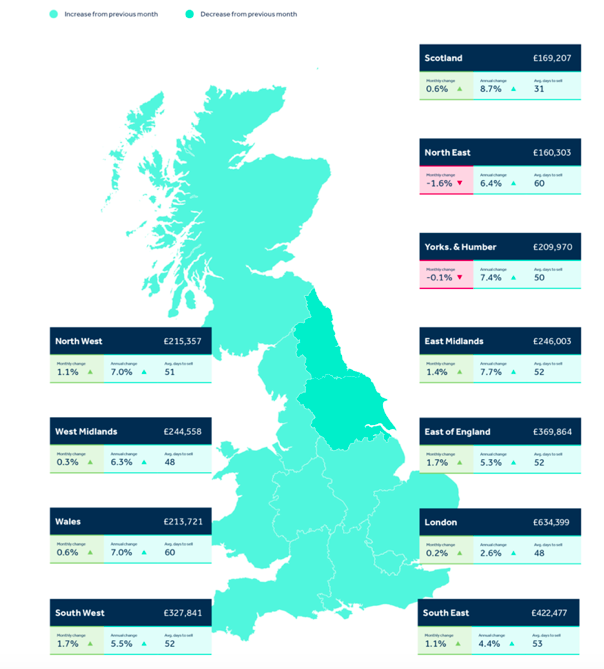
The Regional Trends In Housing Prices
Last of all, we come to the housing prices and changes seen across regions of the UK. Scotland is currently seeing the lowest number of average days to find a buyer at just 31 days. Their average annual change in property prices has also risen by a huge 8.7%, now sitting at £169,207, while the monthly change has been 0.6%. The West Midlands and London are seeing just 48 average days to find a buyer, and their monthly change in property prices are 0.3% and 0.2% respectively. However, while the West Midlands has seen a 6.3% increase in the last year in prices, now at £244,558, London has seen just 2.6% sitting at £634,399. Down in the South, the South West has seen a 1.7% monthly change in pricing and 5.5% annual change, and on average take around 52 days to find a buyer. While the South East have seen a change of 1.1% of the last month, they have by contrast seen a 4.4% change in pricing and similarly take around 53 days to find a buyer. In the East, the East Midlands are seeing a 1.4% change monthly to pricing, while their annual change has been one of the highest at 7.7%, also taking around 52 days on average to find a buyer. Similarly, the East of England has seen a 1.7% change monthly and 5.3% annually.
We hope you found today’s overview of the housing market helpful, up-to-date as of October this year. If you have any questions at all, are looking for advice you can trust on property investment or are looking for help with bridging finance, please do feel free to get in touch with us. You can reach out to us through the contact forms on our website, through email at info@djfam.co.uk or by calling on 0207199648.